Generate a network
For more details on downloading for a boundary, see this example .
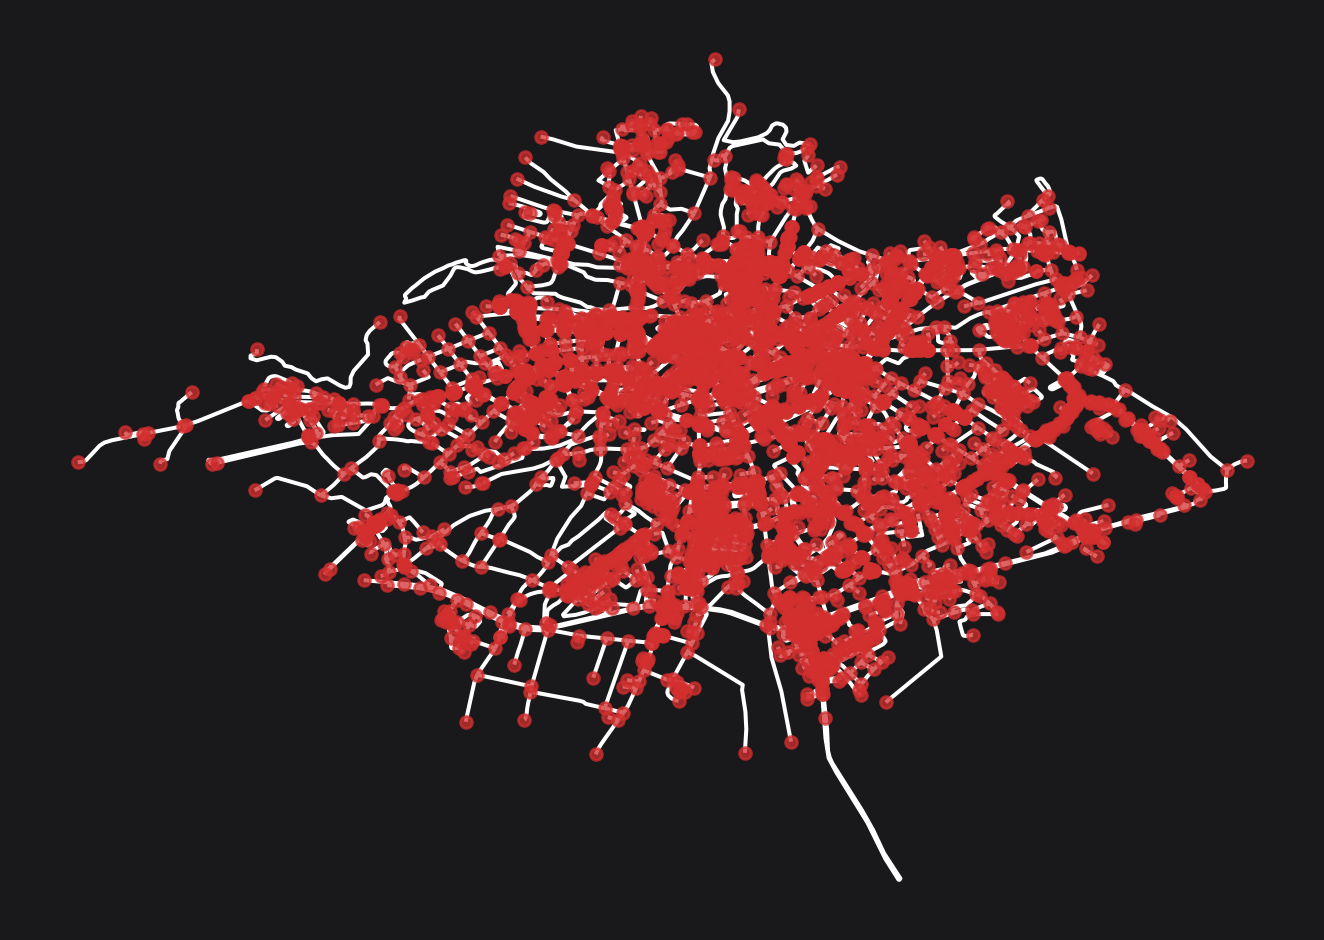
Assume we have the following network.
import osmnx as oxfrom cityseer.tools import io, plot# retrieve a boundary from OSM = ox.geocode_to_gdf("R1536593" , # OSM relation ID = True ,# project = bounds_gdf.to_crs(3035 ) # projected CRS # extract geom = bounds_gdf.union_all().simplify(500 )# extract network for geom = io.osm_graph_from_poly(= 3035 , # set to your CRS = 3035 , # output CRS = False , # set to True for automatic simplification = True )
INFO:cityseer.tools.io:Converting networkX graph from EPSG code 4326 to EPSG code 3035.
INFO:cityseer.tools.io:Processing node x, y coordinates.
  0%|          | 0/20224 [00:00<?, ?it/s]100%|██████████| 20224/20224 [00:00<00:00, 652273.84it/s]
INFO:cityseer.tools.io:Processing edge geom coordinates, if present.
  0%|          | 0/22366 [00:00<?, ?it/s]100%|██████████| 22366/22366 [00:00<00:00, 1239313.08it/s]
INFO:cityseer.tools.graphs:Generating interpolated edge geometries.
  0%|          | 0/22366 [00:00<?, ?it/s] 32%|███▏      | 7057/22366 [00:00<00:00, 70563.17it/s] 63%|██████▎   | 14114/22366 [00:00<00:00, 67480.87it/s] 95%|█████████▍| 21154/22366 [00:00<00:00, 68777.98it/s]100%|██████████| 22366/22366 [00:00<00:00, 67489.94it/s]
INFO:cityseer.tools.graphs:Removing filler nodes.
  0%|          | 0/20224 [00:00<?, ?it/s]  4%|▍         | 888/20224 [00:00<00:02, 8861.33it/s]  9%|▉         | 1775/20224 [00:00<00:02, 7444.29it/s] 13%|█▎        | 2534/20224 [00:00<00:02, 6349.24it/s] 16%|█▌        | 3187/20224 [00:00<00:02, 6392.77it/s] 19%|█▉        | 3876/20224 [00:00<00:02, 6547.35it/s] 24%|██▍       | 4817/20224 [00:00<00:02, 7437.99it/s] 28%|██▊       | 5589/20224 [00:00<00:01, 7522.02it/s] 31%|███▏      | 6362/20224 [00:00<00:01, 7582.44it/s] 36%|███▋      | 7340/20224 [00:00<00:01, 8250.77it/s] 40%|████      | 8189/20224 [00:01<00:01, 8307.75it/s] 47%|████▋     | 9465/20224 [00:01<00:01, 9638.12it/s] 52%|█████▏    | 10616/20224 [00:01<00:00, 10197.29it/s] 58%|█████▊    | 11699/20224 [00:01<00:00, 10384.96it/s] 65%|██████▍   | 13046/20224 [00:01<00:00, 11306.58it/s] 71%|███████   | 14315/20224 [00:01<00:00, 11719.50it/s] 78%|███████▊  | 15681/20224 [00:01<00:00, 12287.92it/s] 85%|████████▌ | 17193/20224 [00:01<00:00, 13121.52it/s] 92%|█████████▏| 18507/20224 [00:01<00:00, 12237.57it/s] 98%|█████████▊| 19744/20224 [00:02<00:00, 12155.01it/s]100%|██████████| 20224/20224 [00:02<00:00, 9890.84it/s]
INFO:cityseer.tools.plot:Preparing graph nodes
INFO:cityseer.tools.plot:Preparing graph edges
  0%|          | 0/8688 [00:00<?, ?it/s] 29%|██▉       | 2524/8688 [00:00<00:00, 25233.47it/s] 58%|█████▊    | 5048/8688 [00:00<00:00, 14886.44it/s] 78%|███████▊  | 6768/8688 [00:00<00:00, 12120.48it/s] 93%|█████████▎| 8121/8688 [00:00<00:00, 10070.11it/s]100%|██████████| 8688/8688 [00:00<00:00, 10967.37it/s]
Convert to GeoPandas
You can now convert the network to a geopandas GeoDataFrame.
# convert to a LineString GeoDataFrame = io.geopandas_from_nx(G_nx, crs= 3035 )
INFO:cityseer.tools.io:Preparing node and edge arrays from networkX graph.
0
LINESTRING (3686215.164 2665464.119, 3686209.1...
[rue de gireugne, rue francoise dolto]
[]
[tertiary]
[0]
False
False
448239596
10746741880
0
1
LINESTRING (3686586.641 2665354.037, 3686435.5...
[]
[]
[track]
[0]
False
False
10746741880
10746741876
0
2
LINESTRING (3686215.164 2665464.119, 3686216.1...
[rue de gireugne]
[]
[tertiary]
[0]
False
False
10746741880
1969279930
0
3
LINESTRING (3683478.127 2667452.761, 3683490.1...
[rue de chatellerault]
[d 925]
[secondary]
[0]
False
False
1563458310
1527199968
0
4
LINESTRING (3683926.884 2667717.073, 3683959.4...
[rue de chatellerault]
[d 925]
[secondary]
[0]
False
False
1527199968
9328420068
0
Save
It is then possible to save the GeoDataFrame. Create a temp folder or update your path accordingly:
from pathlib import Path"../temp" ).mkdir(exist_ok= True ) # for build = "../temp/output_file.gpkg"
INFO:pyogrio._io:Created 8,688 records
The GPKG file can now be explored or modified in GIS software such as QGIS.
Reload
To reload, you can read the data with geopandas.
import geopandas as gpd= gpd.read_file(f_path)
0
['rue de gireugne', 'rue francoise dolto']
[]
['tertiary']
[0]
False
False
448239596
10746741880
0
LINESTRING (3686215.164 2665464.119, 3686209.1...
1
[]
[]
['track']
[0]
False
False
10746741880
10746741876
0
LINESTRING (3686586.641 2665354.037, 3686435.5...
2
['rue de gireugne']
[]
['tertiary']
[0]
False
False
10746741880
1969279930
0
LINESTRING (3686215.164 2665464.119, 3686216.1...
3
['rue de chatellerault']
['d 925']
['secondary']
[0]
False
False
1563458310
1527199968
0
LINESTRING (3683478.127 2667452.761, 3683490.1...
4
['rue de chatellerault']
['d 925']
['secondary']
[0]
False
False
1527199968
9328420068
0
LINESTRING (3683926.884 2667717.073, 3683959.4...
Convert back to nx
Then use cityseer to convert the LineString GeoDataFrame back into a networkx graph.
= io.nx_from_generic_geopandas(in_edges_gdf)= True )
  0%|          | 0/8688 [00:00<?, ?it/s]  7%|▋         | 589/8688 [00:00<00:01, 5880.77it/s] 14%|█▎        | 1182/8688 [00:00<00:01, 5908.76it/s] 20%|██        | 1773/8688 [00:00<00:01, 5780.82it/s] 27%|██▋       | 2383/8688 [00:00<00:01, 5901.68it/s] 34%|███▍      | 2974/8688 [00:00<00:00, 5794.92it/s] 41%|████▏     | 3586/8688 [00:00<00:00, 5900.13it/s] 48%|████▊     | 4193/8688 [00:00<00:00, 5953.56it/s] 55%|█████▌    | 4789/8688 [00:00<00:00, 5924.61it/s] 62%|██████▏   | 5397/8688 [00:00<00:00, 5969.87it/s] 69%|██████▉   | 6010/8688 [00:01<00:00, 6015.47it/s] 76%|███████▌  | 6620/8688 [00:01<00:00, 6040.09it/s] 83%|████████▎ | 7225/8688 [00:01<00:00, 5953.95it/s] 90%|█████████ | 7830/8688 [00:01<00:00, 5980.95it/s] 97%|█████████▋| 8436/8688 [00:01<00:00, 6002.76it/s]100%|██████████| 8688/8688 [00:01<00:00, 5948.49it/s]
INFO:cityseer.tools.graphs:Merging parallel edges within buffer of 1.
  0%|          | 0/8687 [00:00<?, ?it/s]100%|██████████| 8687/8687 [00:00<00:00, 164720.83it/s]
INFO:cityseer.tools.plot:Preparing graph nodes
INFO:cityseer.tools.plot:Preparing graph edges
  0%|          | 0/8686 [00:00<?, ?it/s] 27%|██▋       | 2346/8686 [00:00<00:00, 23451.47it/s] 54%|█████▍    | 4692/8686 [00:00<00:00, 13627.05it/s] 72%|███████▏  | 6278/8686 [00:00<00:00, 10728.75it/s] 86%|████████▋ | 7496/8686 [00:00<00:00, 8787.20it/s]  98%|█████████▊| 8472/8686 [00:00<00:00, 7510.37it/s]100%|██████████| 8686/8686 [00:00<00:00, 9030.27it/s]