for method, shape_exp, descriptor, cmap, inverse, col_by_categ in zip(
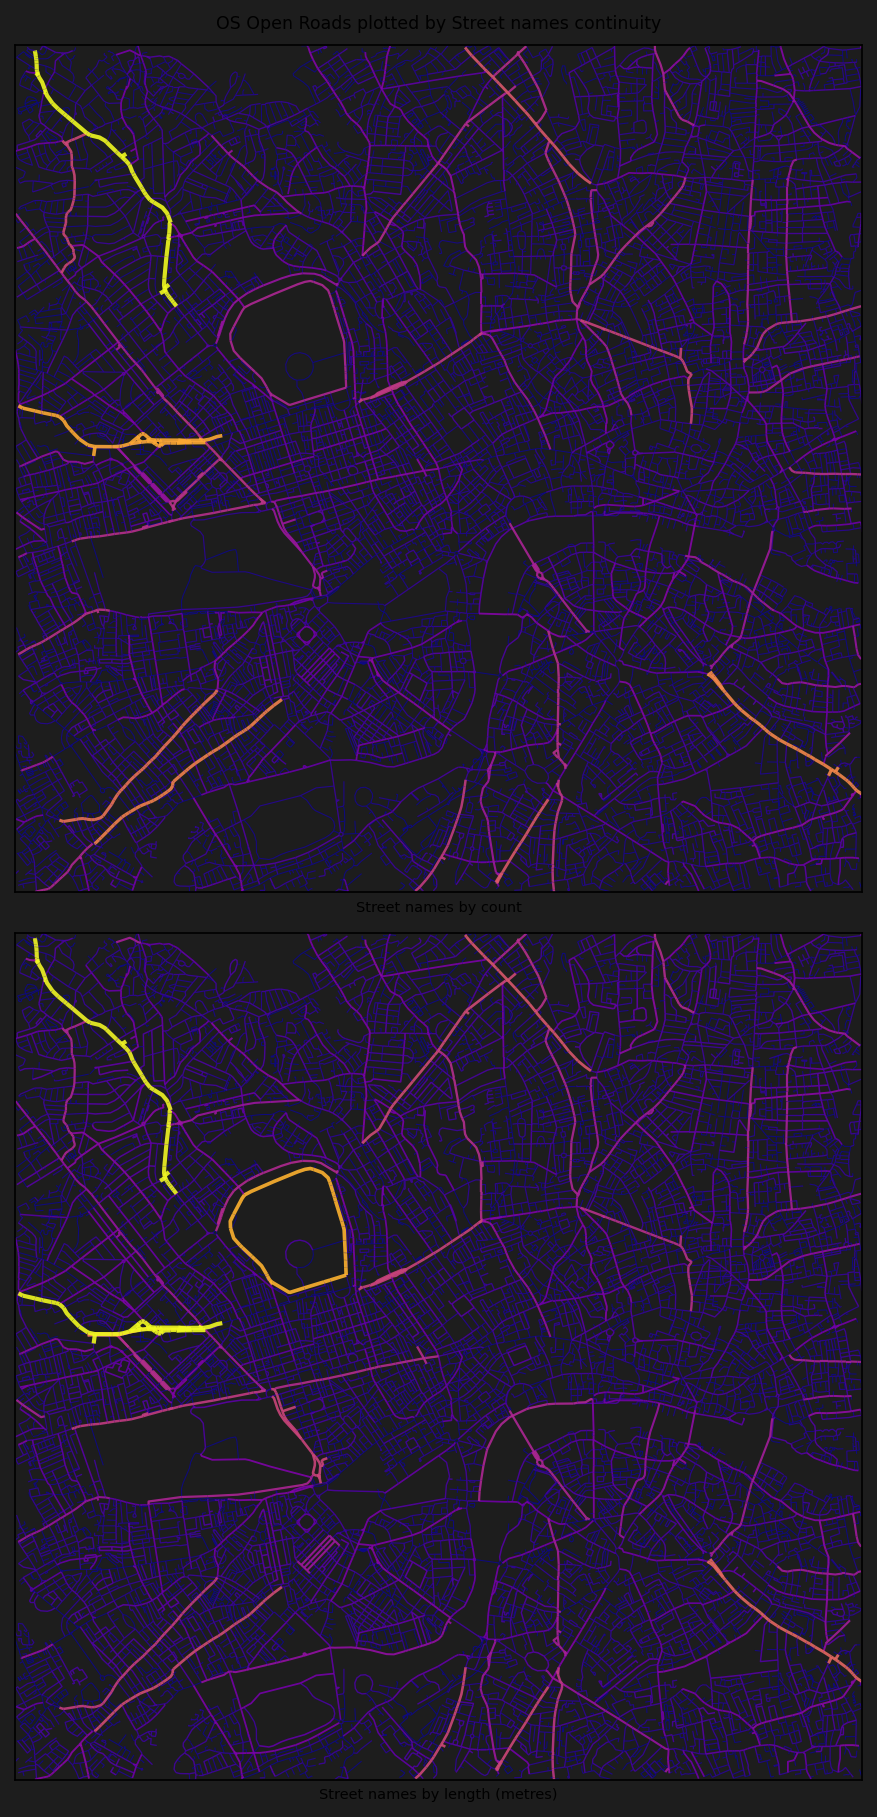
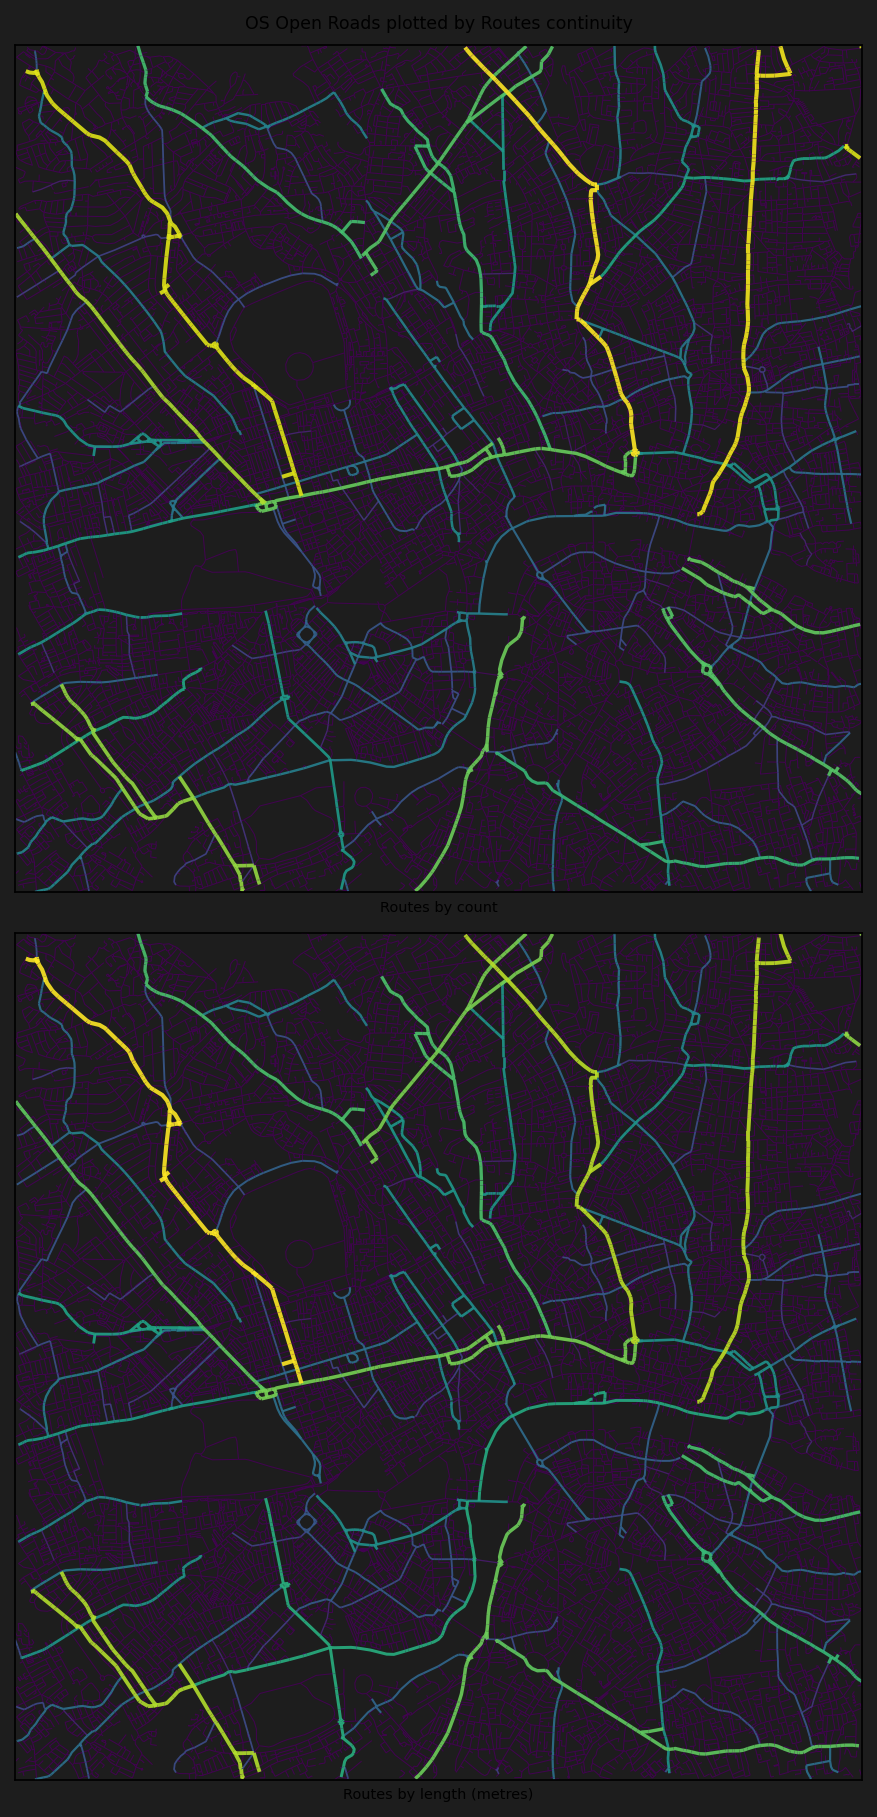
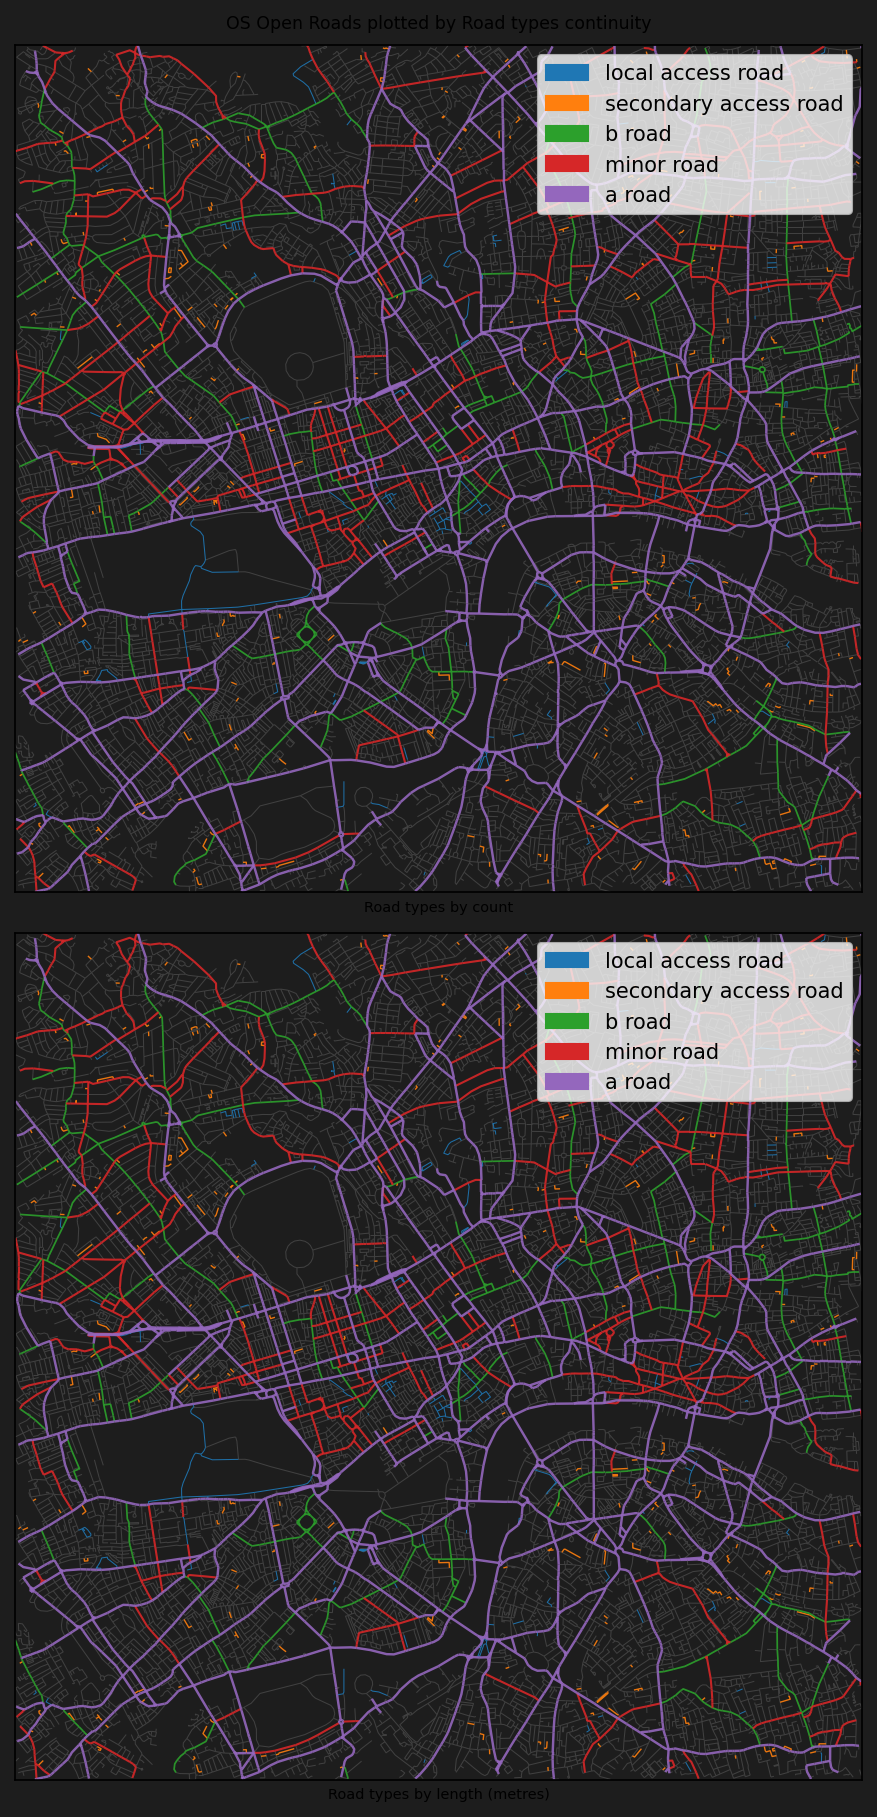
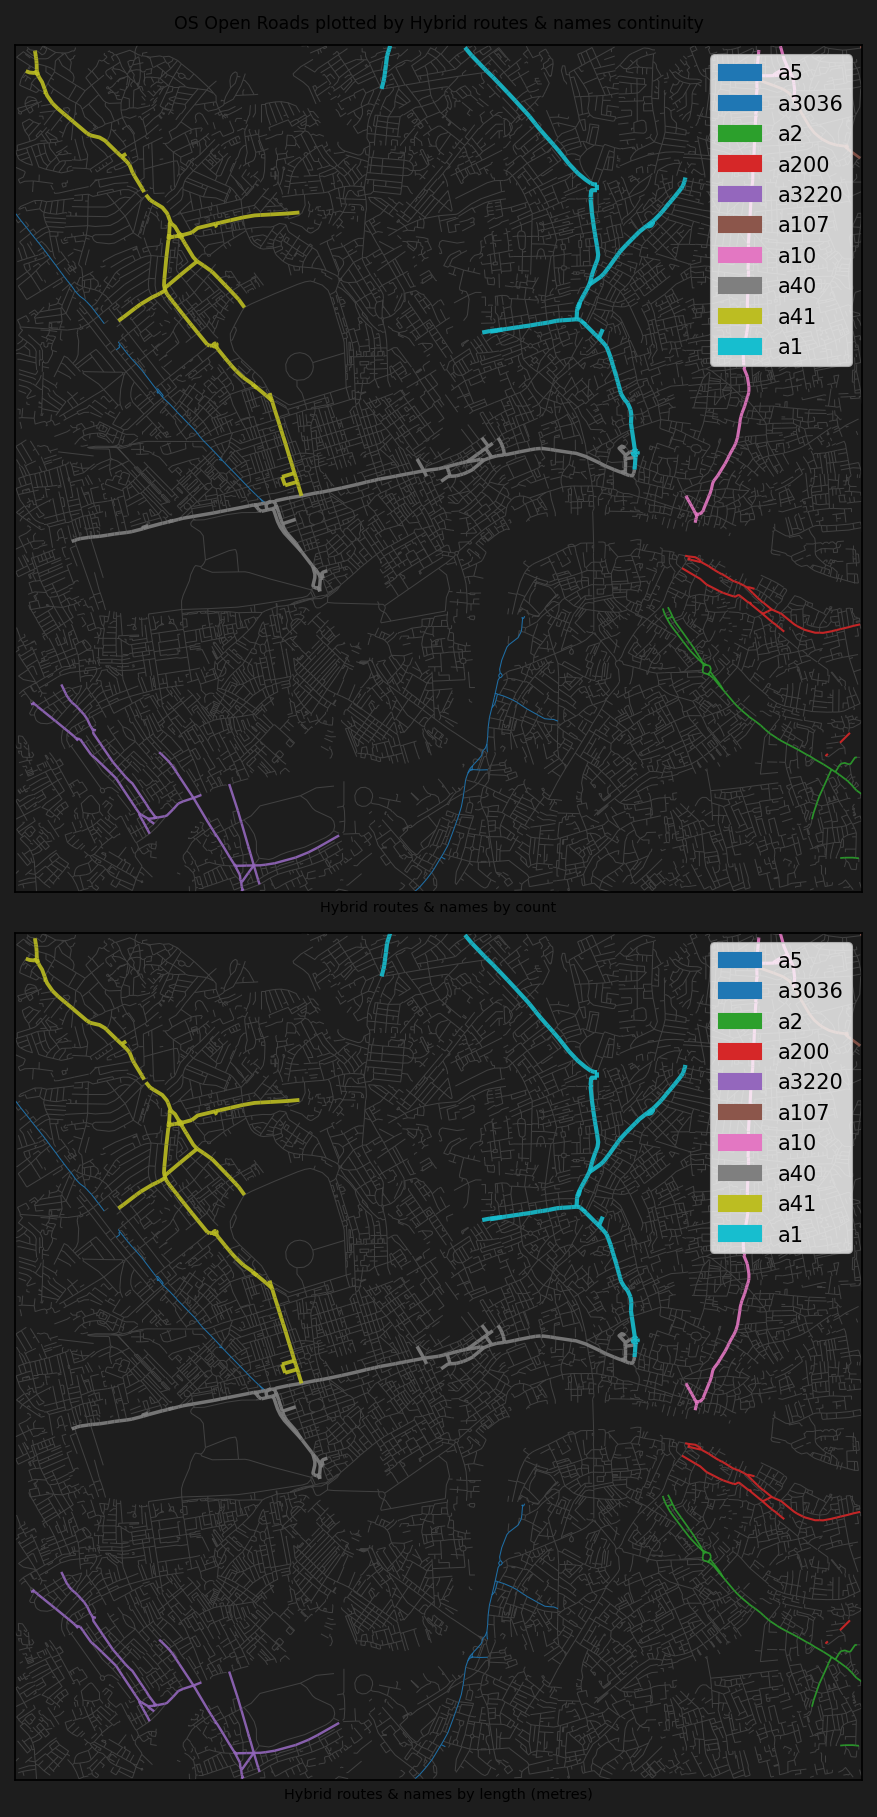
["names", "routes", "highways", "hybrid"], #
[1, 0.75, 0.5, 1], #
["Street names", "Routes", "Road types", "Hybrid routes & names"], #
["plasma", "viridis", "tab10", "tab10"], #
[False, False, True, False], #
[False, False, True, True],
):
print(f"Plotting results for method: {method}")
# plot
bg_colour = "#1d1d1d"
fig, axes = plt.subplots(
2, 1, dpi=150, figsize=(8, 12), facecolor=bg_colour, constrained_layout=True
)
fig.suptitle(
f"OS Open Roads plotted by {descriptor} continuity",
fontsize="small",
ha="center",
)
# by count
plot.plot_nx_edges(
axes[0], # type: ignore
nx_multigraph=G_cont,
edge_metrics_key=f"{method}_cont_by_count",
bbox_extents=plot_bbox,
cmap_key=cmap,
lw_min=0.5,
lw_max=2,
edge_label_key=f"{method}_cont_by_label",
colour_by_categorical=col_by_categ,
shape_exp=shape_exp,
face_colour=bg_colour,
invert_plot_order=inverse,
)
axes[0].set_xlabel(f"{descriptor} by count", fontsize="x-small") # type: ignore
# by length
plot.plot_nx_edges(
axes[1], # type: ignore
nx_multigraph=G_cont,
edge_metrics_key=f"{method}_cont_by_length",
bbox_extents=plot_bbox,
cmap_key=cmap,
lw_min=0.5,
lw_max=2,
edge_label_key=f"{method}_cont_by_label",
colour_by_categorical=col_by_categ,
shape_exp=shape_exp,
face_colour=bg_colour,
invert_plot_order=inverse,
)
axes[1].set_xlabel(f"{descriptor} by length (metres)", fontsize="x-small") # type: ignore
plt.show()