Convert a network from momepy to a cityseer compatible networkx graph.
The process is for converting momepy networks is similar to that for opening street network datasets via geopandas.
import geopandas as gpdimport momepyfrom cityseer.tools import io, plot
/Users/gareth/dev/benchmark-urbanism/cityseer-examples/.venv/lib/python3.12/site-packages/tqdm/auto.py:21: TqdmWarning: IProgress not found. Please update jupyter and ipywidgets. See https://ipywidgets.readthedocs.io/en/stable/user_install.html
  from .autonotebook import tqdm as notebook_tqdm
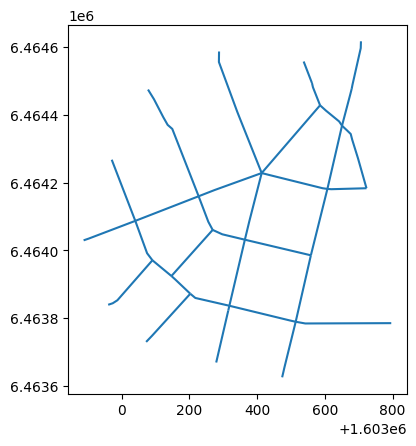
Prepare a momepy street network. Here we will use the momepy example dataset streets which is a GeoDataFrame of street segments.
Use the nx_from_generic_geopandas function to convert the geopandas LineStrings dataset to a networkx graph. This function will automatically create nodes and edges from the LineStrings in the dataset.
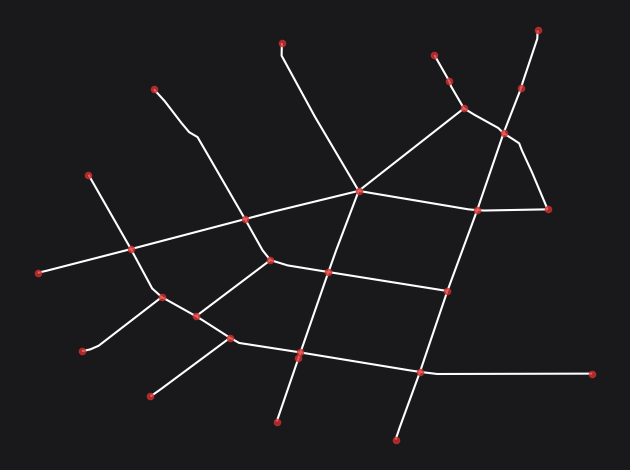
G = io.nx_from_generic_geopandas(streets_gpd)print(G)plot.plot_nx(G, plot_geoms=True)
INFO:cityseer.tools.graphs:Merging parallel edges within buffer of 1.
INFO:cityseer.tools.plot:Preparing graph nodes
INFO:cityseer.tools.plot:Preparing graph edges
MultiGraph with 29 nodes and 35 edges
Conclusion
This notebook demonstrated how to convert a momepy street network (stored as a geopandas GeoDataFrame of LineStrings) into a cityseer-compatible networkx graph using nx_from_generic_geopandas. The same approach applies to any LineString-based street dataset loaded through geopandas.
Next steps: Once your network is ready, proceed to Network Centrality to compute metrics.