import geopandas as gpd
from cityseer.tools import io, plot![]()
OSM network from a boundary file
Use a custom boundary file to create a networkx graph from OSM.
If you have a boundary file in a GeoPackage, shapefile, or similar format, then you can load this file and use it as the boundary for creating a network from OSM.
Use geopandas to load the boundary file. Check that your file path is correct!
bounds_gpd = gpd.read_file("data/madrid_nbhds/madrid_nbhds.gpkg")
bounds_gpd| CODDIS | NOMDIS | COD_BAR | NOMBRE | Shape_Leng | COD_DIS_TX | BARRIO_MAY | COD_DISBAR | NUM_BAR | BARRIO_MT | COD_DISB | geometry | |
|---|---|---|---|---|---|---|---|---|---|---|---|---|
| 0 | 1 | Centro | 011 | Palacio | 0.0 | 01 | PALACIO | 11 | 1 | PALACIO | 1-1 | MULTIPOLYGON (((440112.785 4474645.921, 440078... |
| 1 | 1 | Centro | 012 | Embajadores | 0.0 | 01 | EMBAJADORES | 12 | 2 | EMBAJADORES | 1-2 | MULTIPOLYGON (((440277.382 4473980.839, 440368... |
| 2 | 1 | Centro | 013 | Cortes | 0.0 | 01 | CORTES | 13 | 3 | CORTES | 1-3 | MULTIPOLYGON (((440780.52 4474528.375, 440907.... |
| 3 | 1 | Centro | 014 | Justicia | 0.0 | 01 | JUSTICIA | 14 | 4 | JUSTICIA | 1-4 | MULTIPOLYGON (((440991.949 4474492.423, 440907... |
| 4 | 1 | Centro | 015 | Universidad | 0.0 | 01 | UNIVERSIDAD | 15 | 5 | UNIVERSIDAD | 1-5 | MULTIPOLYGON (((440517.952 4474758.368, 440476... |
| ... | ... | ... | ... | ... | ... | ... | ... | ... | ... | ... | ... | ... |
| 126 | 21 | Barajas | 211 | Alameda de Osuna | 0.0 | 21 | ALAMEDA DE OSUNA | 211 | 1 | ALAMEDA DE OSUNA | 21-1 | MULTIPOLYGON (((450614.387 4479399.407, 450752... |
| 127 | 21 | Barajas | 212 | Aeropuerto | 0.0 | 21 | AEROPUERTO | 212 | 2 | AEROPUERTO | 21-2 | MULTIPOLYGON (((452408.138 4484644.7, 452415.1... |
| 128 | 21 | Barajas | 213 | Casco Histórico de Barajas | 0.0 | 21 | CASCO HISTORICO DE BARAJAS | 213 | 3 | CASCO HISTÓRICO DE BARAJAS | 21-3 | MULTIPOLYGON (((451288.265 4480266.282, 451233... |
| 129 | 21 | Barajas | 214 | Timón | 0.0 | 21 | TIMON | 214 | 4 | TIMÓN | 21-4 | MULTIPOLYGON (((450698.531 4479953.328, 450639... |
| 130 | 21 | Barajas | 215 | Corralejos | 0.0 | 21 | CORRALEJOS | 215 | 5 | CORRALEJOS | 21-5 | MULTIPOLYGON (((448664.865 4478188.825, 448663... |
131 rows × 12 columns
Extract the EPSG code from the boundary file.
epsg_code = bounds_gpd.crs.to_epsg()
print(epsg_code)
print(bounds_gpd.crs.is_projected)
25830
TrueIf the geometry is not in a projected coordinate system, reproject it to a locally projected coordinate system before doing buffering or simplification. This can be done with the built-in to_crs method in geopandas. The EPSG code for the UTM zone can be found at epsg.io. For example, if your boundary is in the UTM zone 30N, you can use code 32630.
For the currently opened file, the boundary is already in a projected coordinate system, so we can skip this step. When working with a file that does need to reprojected, then you can use the following code to project your CRS to a given EPSG code.
# shown as example - unnecessary step for current dataset
bounds_gpd = bounds_gpd.to_crs(epsg=25830)
print(epsg_code)
print(bounds_gpd.crs.is_projected)
25830
TrueConvert the GeoDataFrame into a Polygon using the geopandas union_all method. This will create a single unified shapely geometry.
centro_gpd = bounds_gpd[bounds_gpd["NOMDIS"] == "Centro"]
bounds_geom = centro_gpd.union_all()
bounds_geom
centro_gpd| CODDIS | NOMDIS | COD_BAR | NOMBRE | Shape_Leng | COD_DIS_TX | BARRIO_MAY | COD_DISBAR | NUM_BAR | BARRIO_MT | COD_DISB | geometry | |
|---|---|---|---|---|---|---|---|---|---|---|---|---|
| 0 | 1 | Centro | 011 | Palacio | 0.0 | 01 | PALACIO | 11 | 1 | PALACIO | 1-1 | MULTIPOLYGON (((440112.785 4474645.921, 440078... |
| 1 | 1 | Centro | 012 | Embajadores | 0.0 | 01 | EMBAJADORES | 12 | 2 | EMBAJADORES | 1-2 | MULTIPOLYGON (((440277.382 4473980.839, 440368... |
| 2 | 1 | Centro | 013 | Cortes | 0.0 | 01 | CORTES | 13 | 3 | CORTES | 1-3 | MULTIPOLYGON (((440780.52 4474528.375, 440907.... |
| 3 | 1 | Centro | 014 | Justicia | 0.0 | 01 | JUSTICIA | 14 | 4 | JUSTICIA | 1-4 | MULTIPOLYGON (((440991.949 4474492.423, 440907... |
| 4 | 1 | Centro | 015 | Universidad | 0.0 | 01 | UNIVERSIDAD | 15 | 5 | UNIVERSIDAD | 1-5 | MULTIPOLYGON (((440517.952 4474758.368, 440476... |
| 5 | 1 | Centro | 016 | Sol | 0.0 | 01 | SOL | 16 | 8 | SOL | 1-6 | MULTIPOLYGON (((440205.444 4474642.19, 440480.... |
If the geometries are complex, then the OSM data request may fail due to URL length limitations (because each coordinate has to be passed in the URL). To avoid this, you can use the convex_hull or else the simplify method to reduce the number of points in the geometry.
bounds_geom_simpl = bounds_geom.convex_hull
bounds_geom_simpl
It is best practise to buffer the geometry by an amount matching the farthest distance used for centrality or accessibility calculations, which prevents edge roll-off effects.
bounds_geom_buff = bounds_geom_simpl.buffer(800)
bounds_geom_buff
The shapely Polygon can now be used as before to download and prepare an OSM graph.
# simplification turned off for this example
G = io.osm_graph_from_poly(
    bounds_geom_buff,
    poly_crs_code=epsg_code,
    simplify=True,
)
print(G)
WARNING:cityseer.tools.io:Merging node 13423404199 into 10604931740 due to identical x, y coords.
INFO:cityseer.tools.graphs:Generating interpolated edge geometries.
WARNING:cityseer.tools.util:The to_crs_code parameter 4326 is not a projected CRS
INFO:cityseer.tools.io:Converting networkX graph to CRS code 32630.
WARNING:cityseer.tools.util:The to_crs_code parameter 4326 is not a projected CRS
INFO:cityseer.tools.io:Processing node x, y coordinates.
INFO:cityseer.tools.io:Processing edge geom coordinates, if present.
INFO:cityseer.tools.graphs:Removing filler nodes.
INFO:cityseer.tools.util:Creating edges STR tree.
INFO:cityseer.tools.graphs:Removing filler nodes.
INFO:cityseer.tools.graphs:Removing dangling nodes.
INFO:cityseer.tools.graphs:Removing filler nodes.
INFO:cityseer.tools.util:Creating edges STR tree.
INFO:cityseer.tools.graphs:Splitting opposing edges.
INFO:cityseer.tools.graphs:Squashing opposing nodes
INFO:cityseer.tools.graphs:Merging parallel edges within buffer of 25.
INFO:cityseer.tools.util:Creating edges STR tree.
INFO:cityseer.tools.graphs:Splitting opposing edges.
INFO:cityseer.tools.graphs:Squashing opposing nodes
INFO:cityseer.tools.graphs:Merging parallel edges within buffer of 25.
INFO:cityseer.tools.util:Creating edges STR tree.
INFO:cityseer.tools.graphs:Splitting opposing edges.
INFO:cityseer.tools.graphs:Squashing opposing nodes
INFO:cityseer.tools.graphs:Merging parallel edges within buffer of 25.
INFO:cityseer.tools.util:Creating edges STR tree.
INFO:cityseer.tools.graphs:Splitting opposing edges.
INFO:cityseer.tools.graphs:Squashing opposing nodes
INFO:cityseer.tools.graphs:Merging parallel edges within buffer of 25.
INFO:cityseer.tools.util:Creating nodes STR tree
INFO:cityseer.tools.graphs:Consolidating nodes.
INFO:cityseer.tools.graphs:Merging parallel edges within buffer of 25.
INFO:cityseer.tools.graphs:Removing filler nodes.
INFO:cityseer.tools.util:Creating nodes STR tree
INFO:cityseer.tools.graphs:Consolidating nodes.
INFO:cityseer.tools.graphs:Merging parallel edges within buffer of 25.
INFO:cityseer.tools.graphs:Removing filler nodes.
INFO:cityseer.tools.util:Creating nodes STR tree
INFO:cityseer.tools.graphs:Consolidating nodes.
INFO:cityseer.tools.graphs:Merging parallel edges within buffer of 25.
INFO:cityseer.tools.graphs:Removing filler nodes.
INFO:cityseer.tools.util:Creating nodes STR tree
INFO:cityseer.tools.graphs:Consolidating nodes.
INFO:cityseer.tools.graphs:Merging parallel edges within buffer of 25.
INFO:cityseer.tools.graphs:Removing filler nodes.
INFO:cityseer.tools.util:Creating nodes STR tree
INFO:cityseer.tools.util:Creating edges STR tree.
INFO:cityseer.tools.graphs:Snapping gapped endings.
INFO:cityseer.tools.util:Creating edges STR tree.
INFO:cityseer.tools.graphs:Splitting opposing edges.
INFO:cityseer.tools.graphs:Merging parallel edges within buffer of 25.
INFO:cityseer.tools.graphs:Removing dangling nodes.
INFO:cityseer.tools.graphs:Removing filler nodes.
INFO:cityseer.tools.util:Creating edges STR tree.
INFO:cityseer.tools.graphs:Splitting opposing edges.
INFO:cityseer.tools.graphs:Squashing opposing nodes
INFO:cityseer.tools.graphs:Merging parallel edges within buffer of 25.
INFO:cityseer.tools.util:Creating nodes STR tree
INFO:cityseer.tools.graphs:Consolidating nodes.
INFO:cityseer.tools.graphs:Merging parallel edges within buffer of 25.
INFO:cityseer.tools.graphs:Removing filler nodes.
INFO:cityseer.tools.graphs:Merging parallel edges within buffer of 50.
INFO:cityseer.tools.graphs:Ironing edges.
INFO:cityseer.tools.graphs:Merging parallel edges within buffer of 1.
INFO:cityseer.tools.graphs:Removing dangling nodes.
INFO:cityseer.tools.graphs:Removing filler nodes.MultiGraph with 2916 nodes and 4664 edgesSetting the x_lim and y_lim extents will effectively zoom-in so that the results of the query can be seen more clearly.
plot.plot_nx(
    G,
    plot_geoms=True,
    x_lim=(439500, 439500 + 2000),
    y_lim=(4473500, 4473500 + 2000),
)
INFO:cityseer.tools.plot:Preparing graph nodes
INFO:cityseer.tools.plot:Preparing graph edges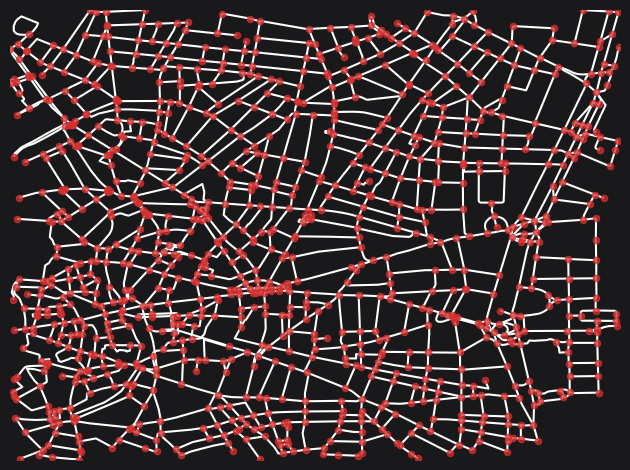
Conclusion
This notebook demonstrated how to load a custom boundary file (e.g. GeoPackage or shapefile) with geopandas, prepare the geometry through union, simplification, and buffering, and then use it to download and create an OSM street network graph. Buffering the boundary by the analysis distance is recommended to prevent edge roll-off effects in subsequent centrality or accessibility calculations.
Next steps: To use an OSM relation ID instead, see Relation ID.