import geopandas as gpd
from cityseer.tools import io, plot![]()
Custom network from a streets dataset
Use geopandas to open a street network file and convert it to a networkx graph.
If you have a street network file in a GeoPackage, shapefile, or similar format, then you can load this file and convert it to a networkx graph.
Use geopandas to load the street network file. Check that your file path is correct!
streets_gpd = gpd.read_file("data/madrid_streets/street_network.gpkg")
streets_gpd.head()| clased | nombre | geometry | |
|---|---|---|---|
| 0 | Urbano | ALMANZOR | MULTILINESTRING ((429937 4446780, 429947 44468... |
| 1 | Urbano | ANETO | MULTILINESTRING ((429804 4446863, 429921 44467... |
| 2 | Urbano | PEÑALARA | MULTILINESTRING ((429804 4446863, 429947 44468... |
| 3 | Urbano | ALMANZOR | MULTILINESTRING ((429947 4446831, 429960 44468... |
| 4 | Carretera convencional | M-417 | MULTILINESTRING ((430171 4446978, 430175 44469... |
Take note of you data CRS.
epsg_code = streets_gpd.crs.to_epsg()
print(epsg_code)
print(streets_gpd.crs.is_projected)
25830
TrueIf your street network is not in a projected CRS, it is recommended to convert your dataset to a locally projected coordinate system. This can be done with the built-in to_crs method in geopandas. The EPSG code for the UTM zone can be found at epsg.io.
Alternatively, you can project the graph after creation.
# shown as example - unnecessary step for current dataset
streets_gpd = streets_gpd.to_crs(epsg=25830)
print(epsg_code)
print(streets_gpd.crs.is_projected)
25830
TrueTake note of the geometry type.
streets_gpd.geometry.type.unique()array(['MultiLineString'], dtype=object)If your data consists of MultiLineString geometries, then these should first be converted to unnested LineString geometries.
streets_gpd = streets_gpd.explode(ignore_index=True)
streets_gpd.geometry.type.unique()
array(['LineString'], dtype=object)Use the nx_from_generic_geopandas function to convert the geopandas LineStrings dataset to a networkx graph. This function will automatically create nodes and edges from the LineStrings in the dataset.
The function expects that all features are LineString geometries, where the geometries represent individual street segments that meet at intersections. Street segments which share endpoints will be connected by a node in the graph.
G = io.nx_from_generic_geopandas(streets_gpd)
print(G)
INFO:cityseer.tools.graphs:Merging parallel edges within buffer of 1.MultiGraph with 154158 nodes and 220036 edgesplot.plot_nx(
G,
plot_geoms=True,
x_lim=(438500, 438500 + 3500),
y_lim=(4472500, 4472500 + 3500),
)INFO:cityseer.tools.plot:Preparing graph nodes
INFO:cityseer.tools.plot:Preparing graph edges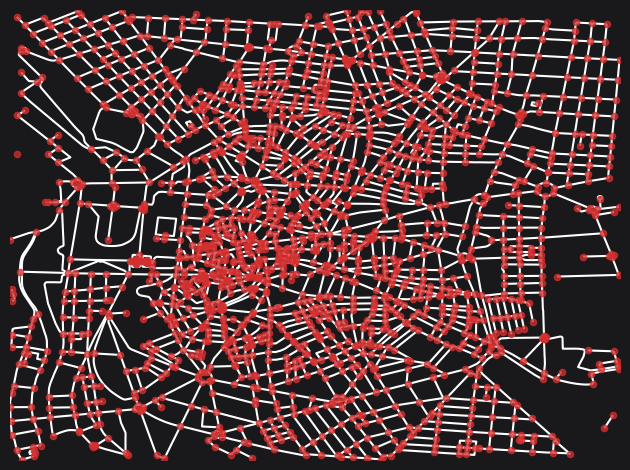
If your data is not in a projected CRS (and if you did not already reproject the GeoDataFrame before creating the graph), then reproject your networkx graph to a locally projected coordinate system before doing further analysis.
If the data is currently in geographic longitudes and latitudes (WGS84 / 4326) then the nx_wgs_to_utm function can be used to convert it to the local UTM projection. Alternatively, the nx_epsg_conversion function can be used to specify input and output CRS.
# shown as an example - unnecessary step for current dataset
G_utm = io.nx_epsg_conversion(G, to_crs_code=32630)
print(G_utm)
INFO:cityseer.tools.io:Converting networkX graph to CRS code 32630.
INFO:cityseer.tools.io:Processing node x, y coordinates.
INFO:cityseer.tools.io:Processing edge geom coordinates, if present.MultiGraph with 154158 nodes and 220036 edgesConclusion
This notebook demonstrated how to load a custom street network file (e.g. GeoPackage or shapefile) using geopandas and convert it to a cityseer-compatible networkx graph with nx_from_generic_geopandas. It covered handling MultiLineString geometries by exploding them to LineStrings, verifying the CRS, and optionally reprojecting the resulting graph.
Next steps: To convert networks from other libraries, see osmnx conversion or momepy conversion.