from cityseer.metrics import visibilityVGA from OSM data
Generate a visual graph analysis (VGA) from OpenStreetMap (OSM) data.
Use the visibility module to create a VGA from OSM data. The VGA will be generated based on the OSM data provided to the visibility_graph_from_osm method.
Pay particular attention to:
- The
bounds_wgsparameter, which defines the geographical area in longitude and latitude to analyze. The order is Left, Bottom, Right, Top. - The
out_pathparameter, which specifies where to save the output files. The filepath must exist. The extension of the output file will be.tifand the file will be saved in GeoTIFF format, which can be opened in QGIS. - The
to_crs_codeparameter, which specifies the coordinate reference system (CRS) to use for the output. The default is the local UTM, but you can change it to any valid CRS code. - The
view_distanceandresolutionparameters, which control the analysis granularity.
There is a performance trade-off for the bounds, view_distance, and resolution. A larger view_distance or higher resolution will result in a more detailed graph but may take longer to compute and require more memory.
visibility.visibility_graph_from_osm(
    bounds_wgs=(18.41077, -33.93154, 18.42755, -33.91626),
    out_path="recipes/visibility/images/ct_vis",
    to_crs_code=None,  # defaults to local UTM
    view_distance=100,  # can use a larger view distance - but slower
    resolution=2,  # set resolution - e.g. 2m
)
INFO:cityseer.metrics.visibility:Preparing buildings raster.
INFO:cityseer.metrics.visibility:Running visibility.
100%|██████████| 690999/690999 [02:40<00:00, 4305.88it/s]The output will generate three files:
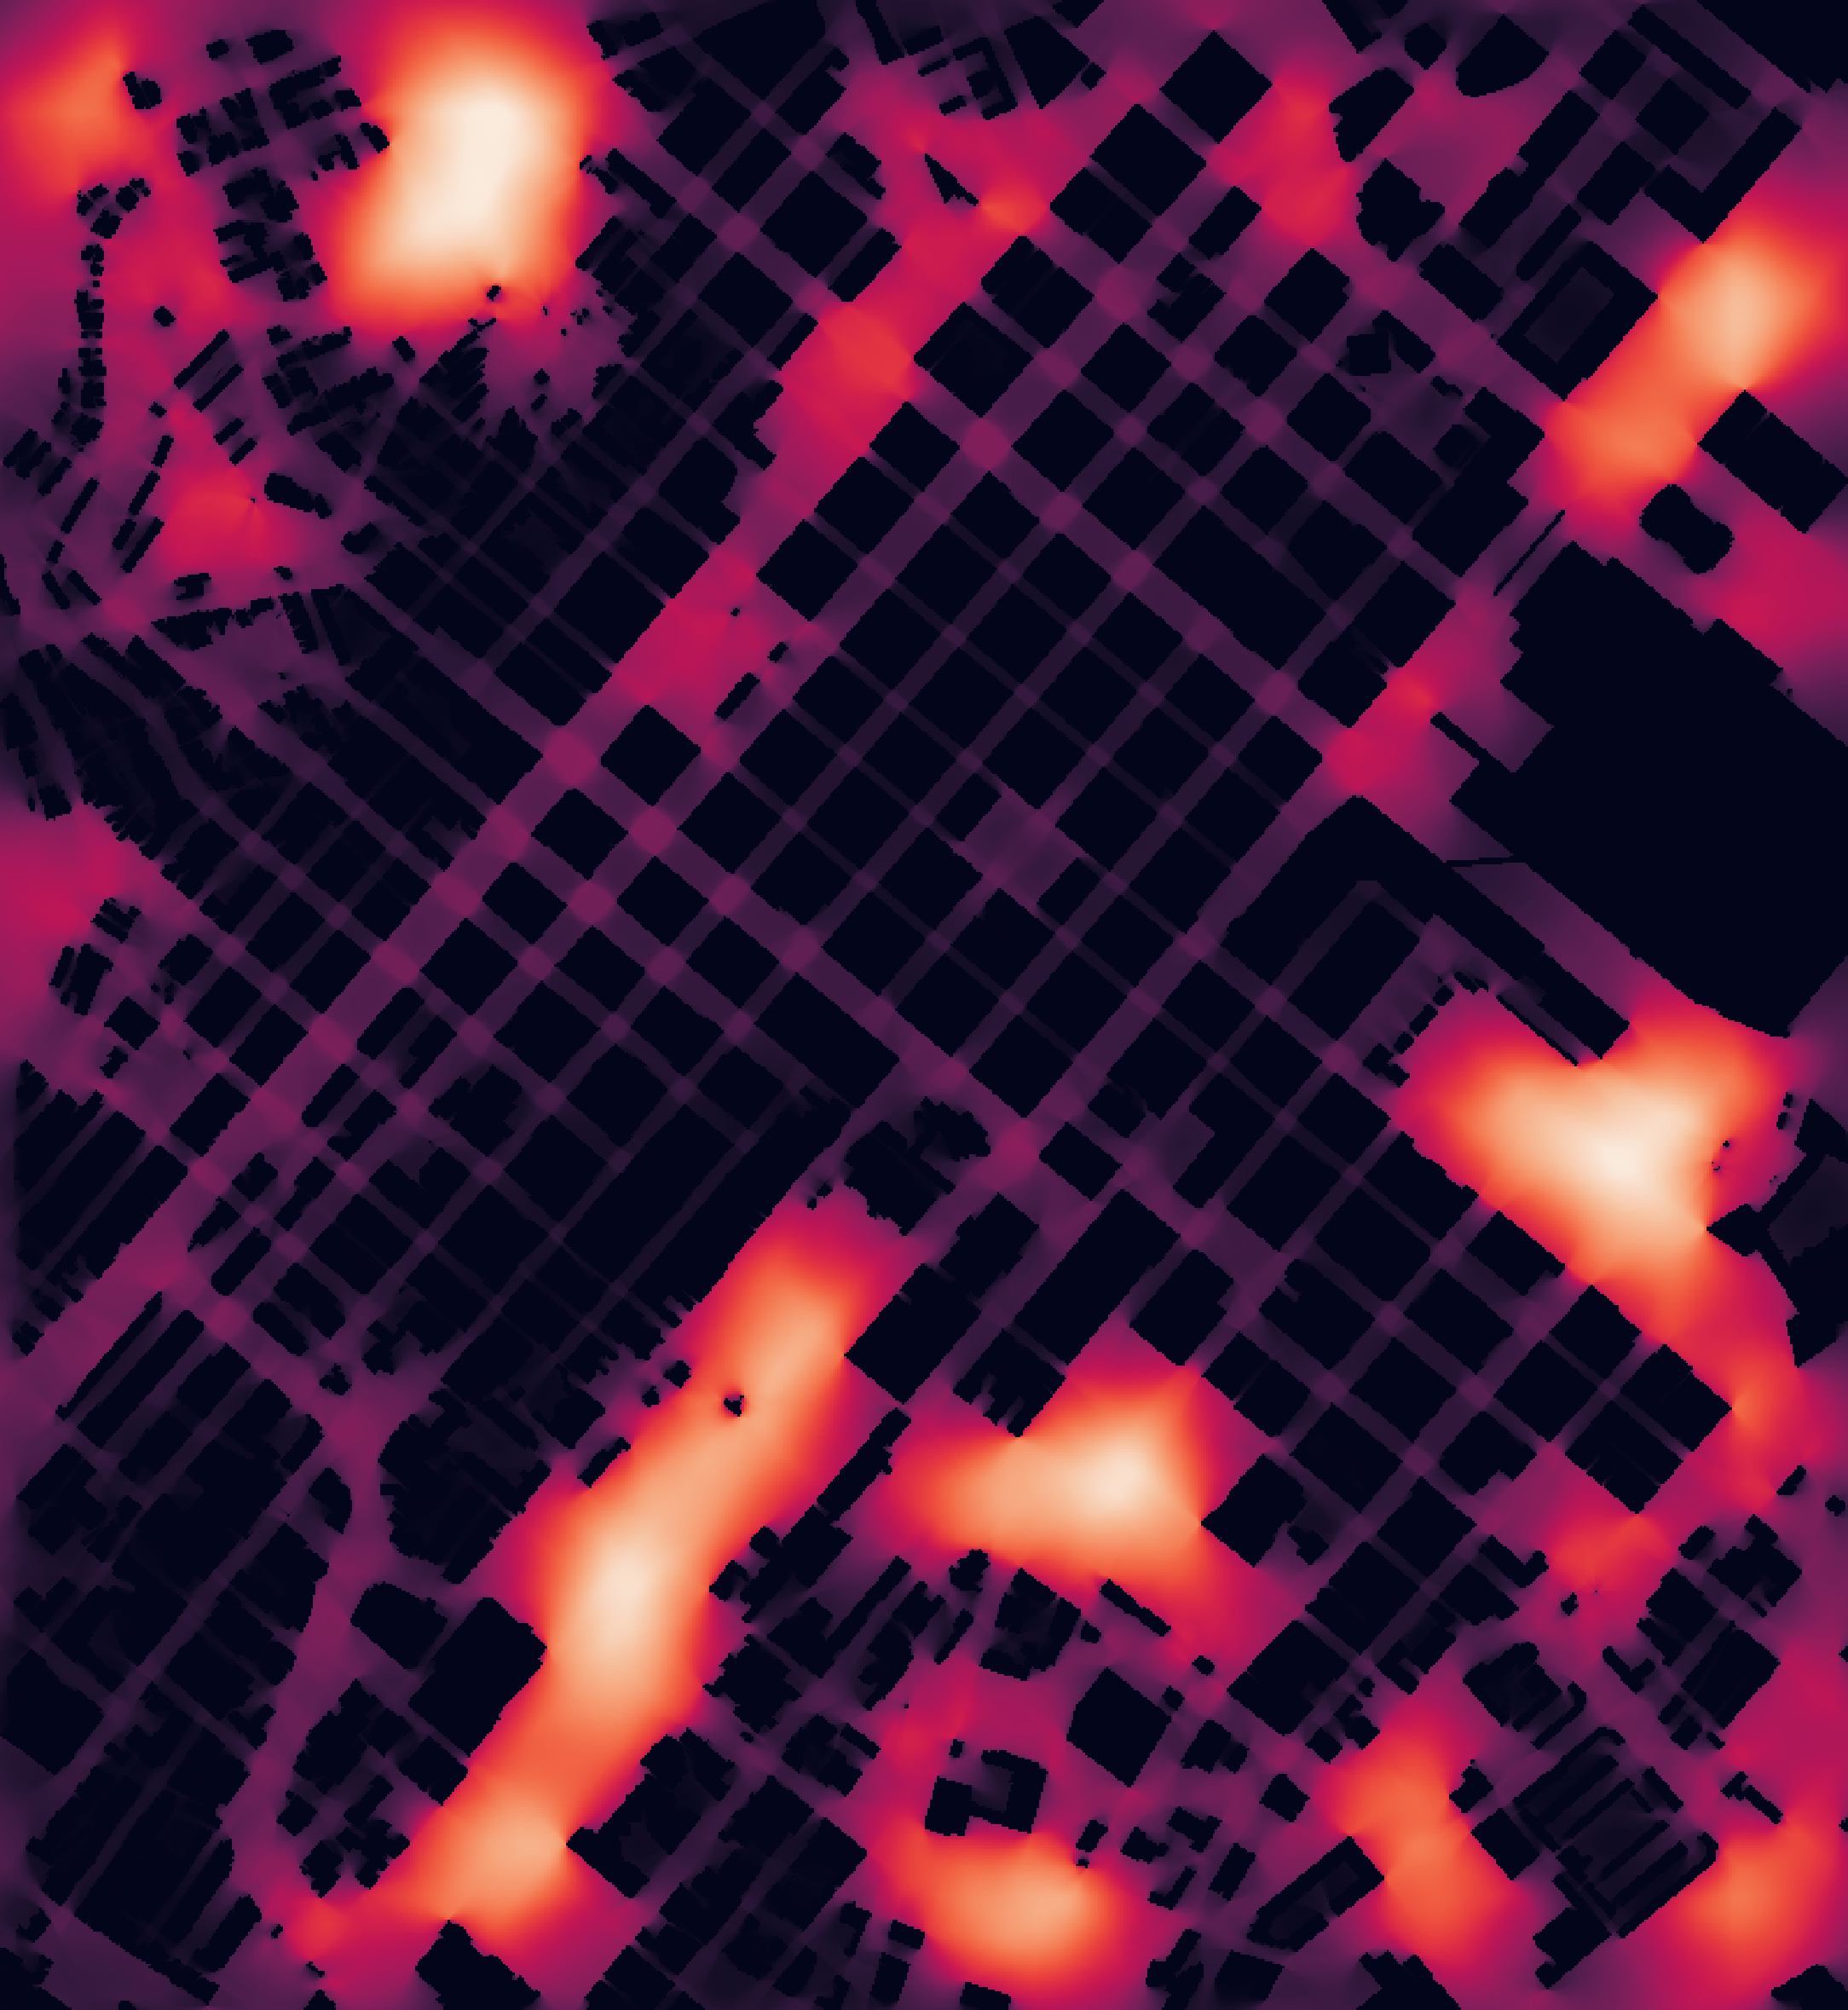
- A
densitymeasure - the number of visible pixels. - A
farnessmeasure - the summed distance to visible pixels - favours farther views (up toview_distance). - A
harmoniccloseness measure - the summed inverse of the distance to visible pixels - favours close adjacency to open spaces.