from cityseer.metrics import visibility![]()
Visibility from raster data
Generate a visibility analysis from raster data. This approach allows for blending building footprints with Digital Elevation Model (DEM) data to take elevation into account.
Use the visibility module to create a visibility analysis from raster data. The visibility will be generated based on the raster data provided to the visibility_from_raster method.
Pay particular attention to:
- The
input_pathparameter, which specifies the path to the input raster file. The file must exist and be in a format that can be read byrasterio, such as GeoTIFF. - The
out_pathparameter, which specifies where to save the output files. The filepath must exist. The extension of the output file will be.tifand the file will be saved in GeoTIFF format, which can be opened in QGIS.
There is a performance trade-off for the view_distance and input file resolution. A larger view_distance or higher resolution will result in a more detailed graph but may take longer to compute and require more memory.
visibility.visibility_from_raster(
    "recipes/visibility/images/madrid_rast_ht.tif",
    "recipes/visibility/images/madrid_vis_from_rast",
    view_distance=100,
    observer_height=1.5,
)  # defaults to local UTM
INFO:cityseer.metrics.visibility:Running visibility graph from raster file: /Users/gareth/dev/benchmark-urbanism/cityseer-examples/recipes/visibility/images/madrid_rast_ht.tif.
INFO:cityseer.metrics.visibility:Raster resolution: 2.0 meters per pixelVisualised as harmonic on a dataset of building rasters including building rooftop heights. (No DEM data used in this example.)
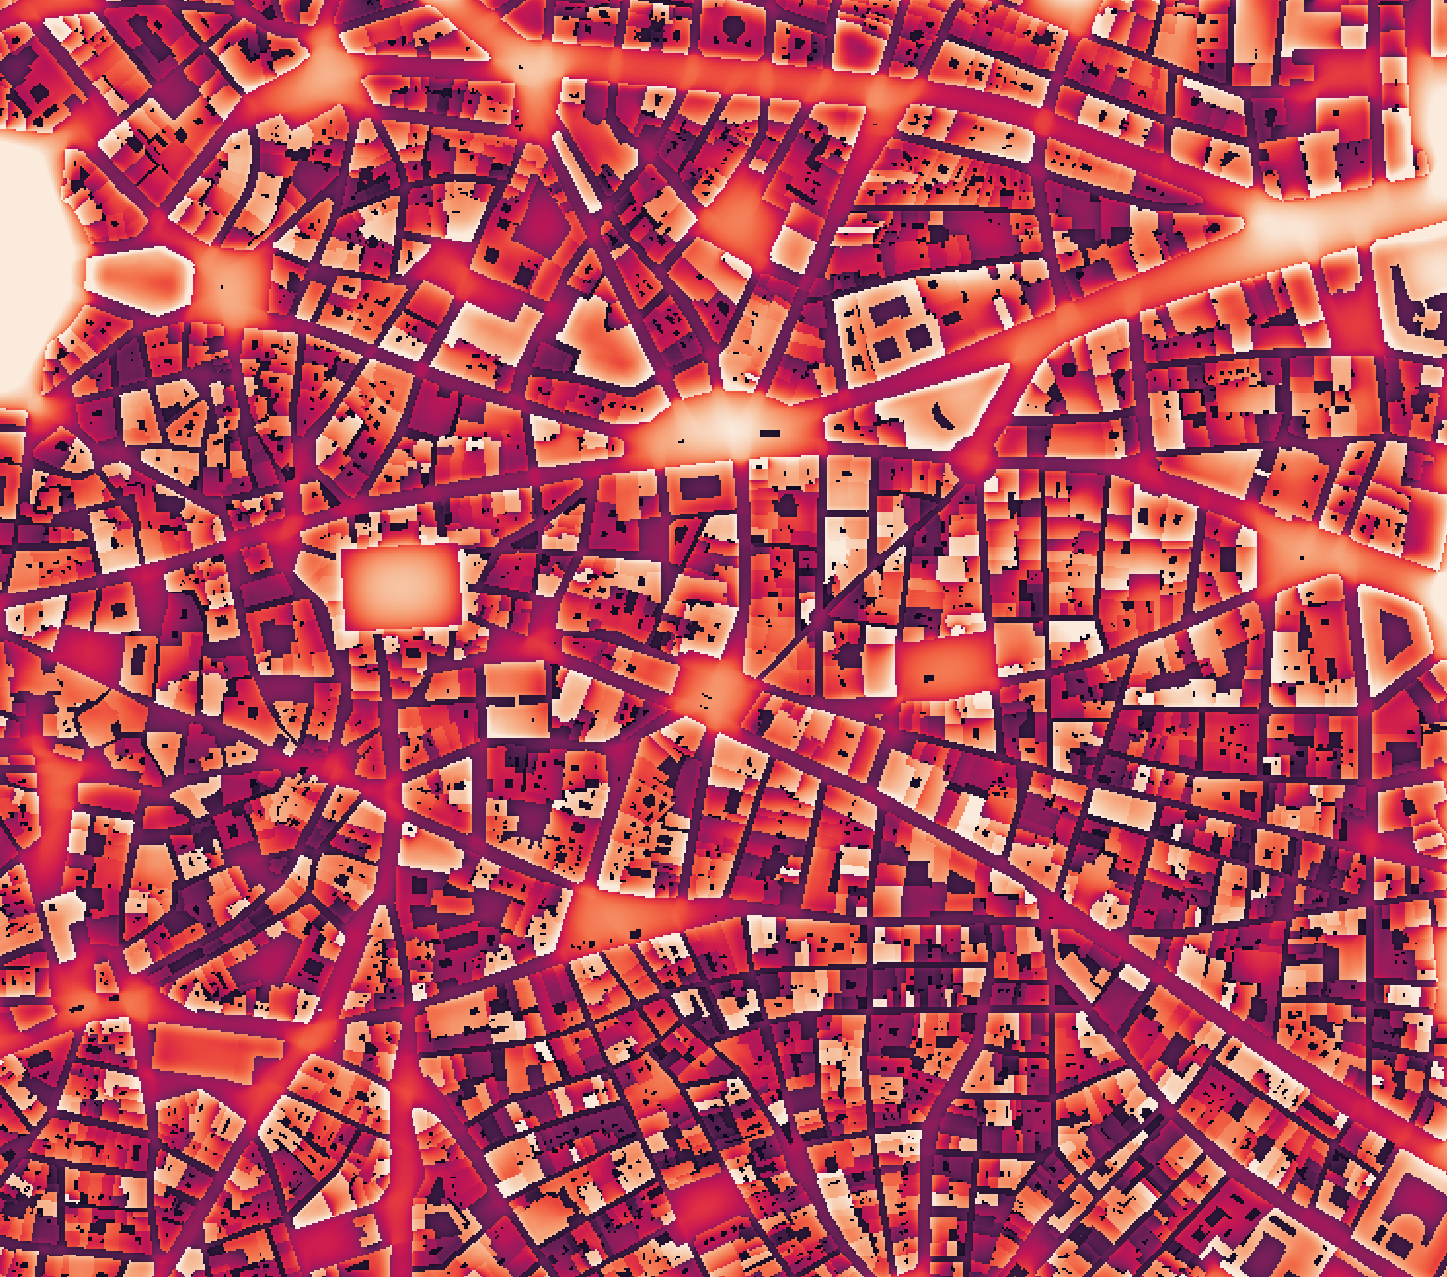
Conclusion
This notebook demonstrated how to generate a visibility analysis from raster data using visibility_from_raster, which can incorporate building heights and Digital Elevation Model (DEM) data to account for terrain. The observer height parameter allows simulating pedestrian-level views, and the output rasters (density, farness, harmonic) capture visibility patterns influenced by both buildings and topography.
Next steps: For street continuity analysis, see Continuity.